
One measurable quality score for your whole codebase.
ArchScan scans the whole codebase and reports SOLID violations, dependency issues and architectural smells with a category-weighted score.

Screens from a running installation
Anatomy of a report
Every scan produces a full, seven-section report.
Summary score
One weighted score + status.
Findings
With code snippet and file location.
SOLID
Violation breakdown per principle.
Packages
Dependencies and versions.
Projects
Per-project metrics.
Dependency map
Interactive graph view.
From repository to score
A full scan reads the whole codebase in your CI; the panel turns what it finds into a score you can compare release to release.
-
The whole repository
On a schedule, on demand or alongside the MR pipeline, in nine languages.
-
Analyser in your CI
Rules come from the panel; the repository is never uploaded.
-
What comes back
Findings with code snippets, packages and versions, per-project metrics, line counts.
-
Scored in the panel
Severity-weighted findings per 1,000 lines, then duplication and complexity.
-
Report and map
The seven-section report, the dependency map and an HTML/PDF export.
How the score is calculated
The same formula for every project, so a small service and a large monolith are judged fairly.
Each finding is weighted by its severity.
The weights are counted per 1,000 lines of code; as that density rises, the score falls exponentially.
Then deductions: duplication above 3% costs up to 15 points, methods with complexity above 20 up to 10.
Ceilings: one critical finding caps the score at 79; five critical findings, or one error per 1,000 lines, cap it at 69.
See your architecture, don't just read it
Cross-project dependencies come alive in an interactive graph - spot cycles and leaks at a glance. Export the report as shareable HTML/PDF.
- Allowed dependency
- Layer breach: the domain depends on infrastructure
- Cycle: application and infrastructure depend on each other
First the layering you intended, then what the code really does. ArchScan's map draws the second picture from the code itself.
What's inside the report
Every scan turns into a concrete scorecard your team can act on.
Category-weighted score
Architecture, SOLID, dependency and metric categories collapse into one weighted score that's comparable across releases.
Findings with code snippets
Each finding ships with the relevant code snippet and exact file location - no guessing, jump straight to the line.
SOLID breakdown per principle
Violations are split across the five SOLID principles, so you see exactly where you struggle most.
Package & project metrics
Dependencies, versions and per-project metrics are gathered in one report.
Interactive dependency map
Cross-project dependencies are explorable in an interactive graph - spot cycles and layer leaks at a glance.
Shareable export
Export the report as HTML/PDF, with the report language set per workspace. The scan runs in your own CI.
See it in the product
All screenshots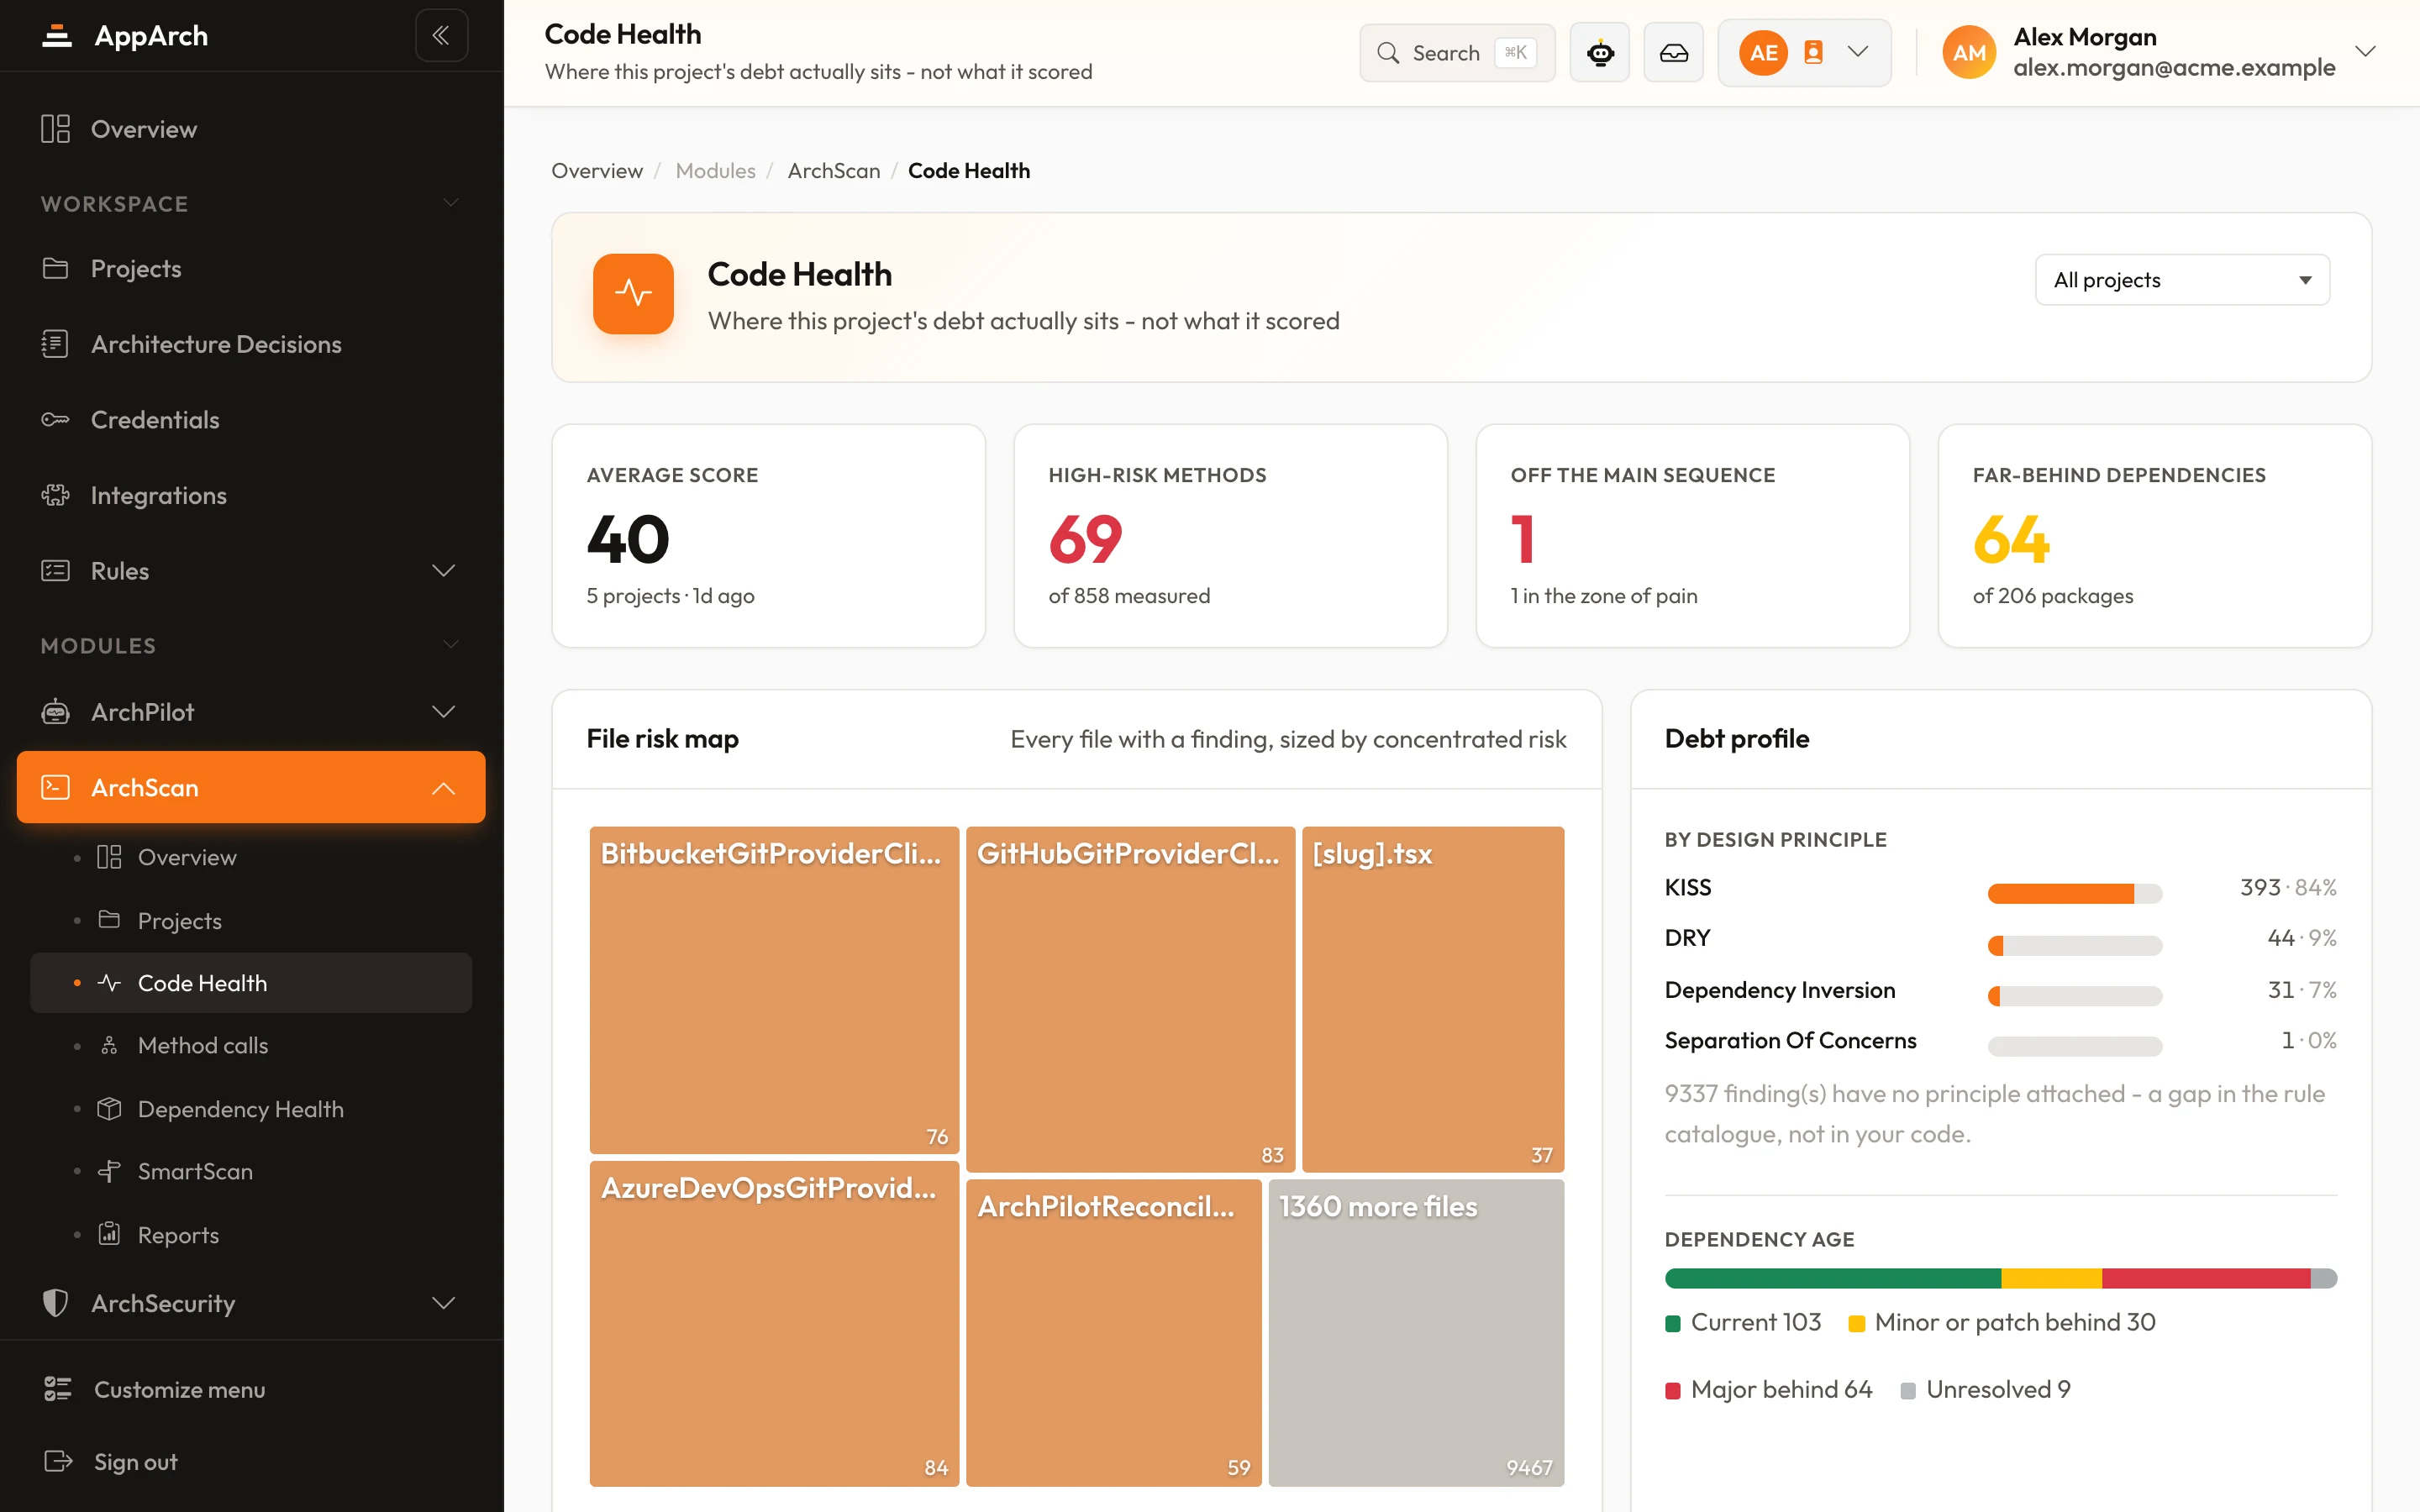
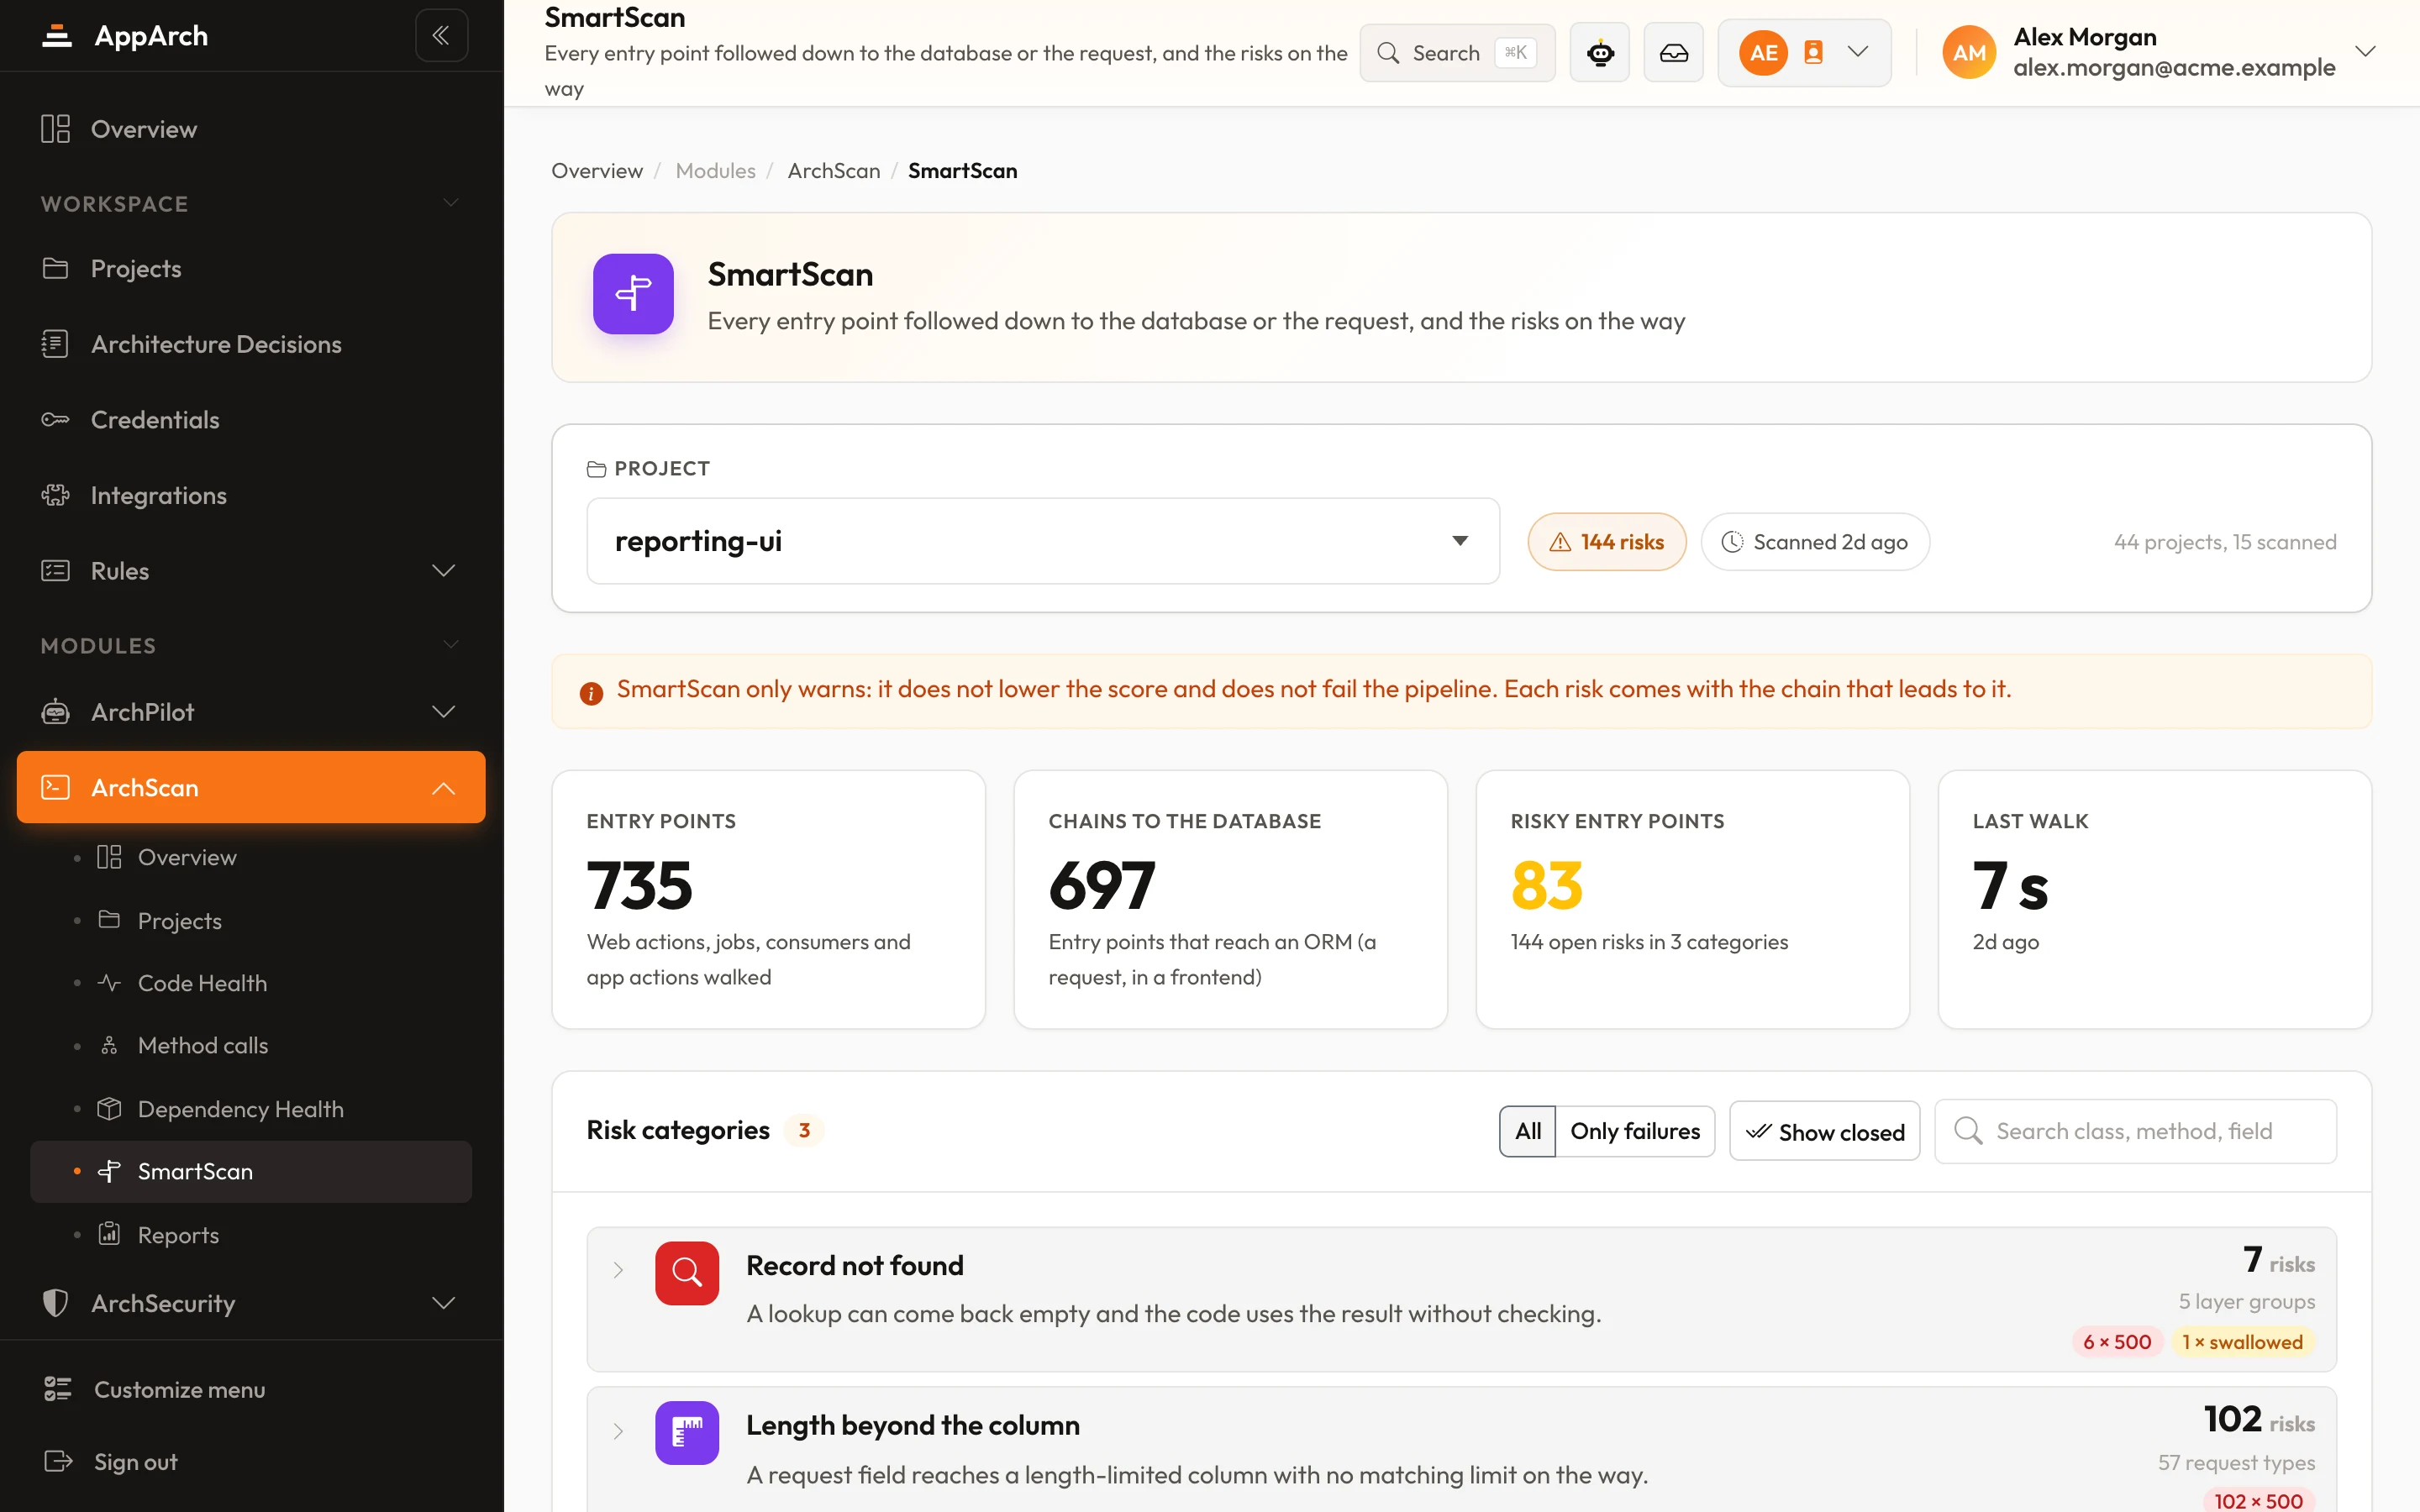
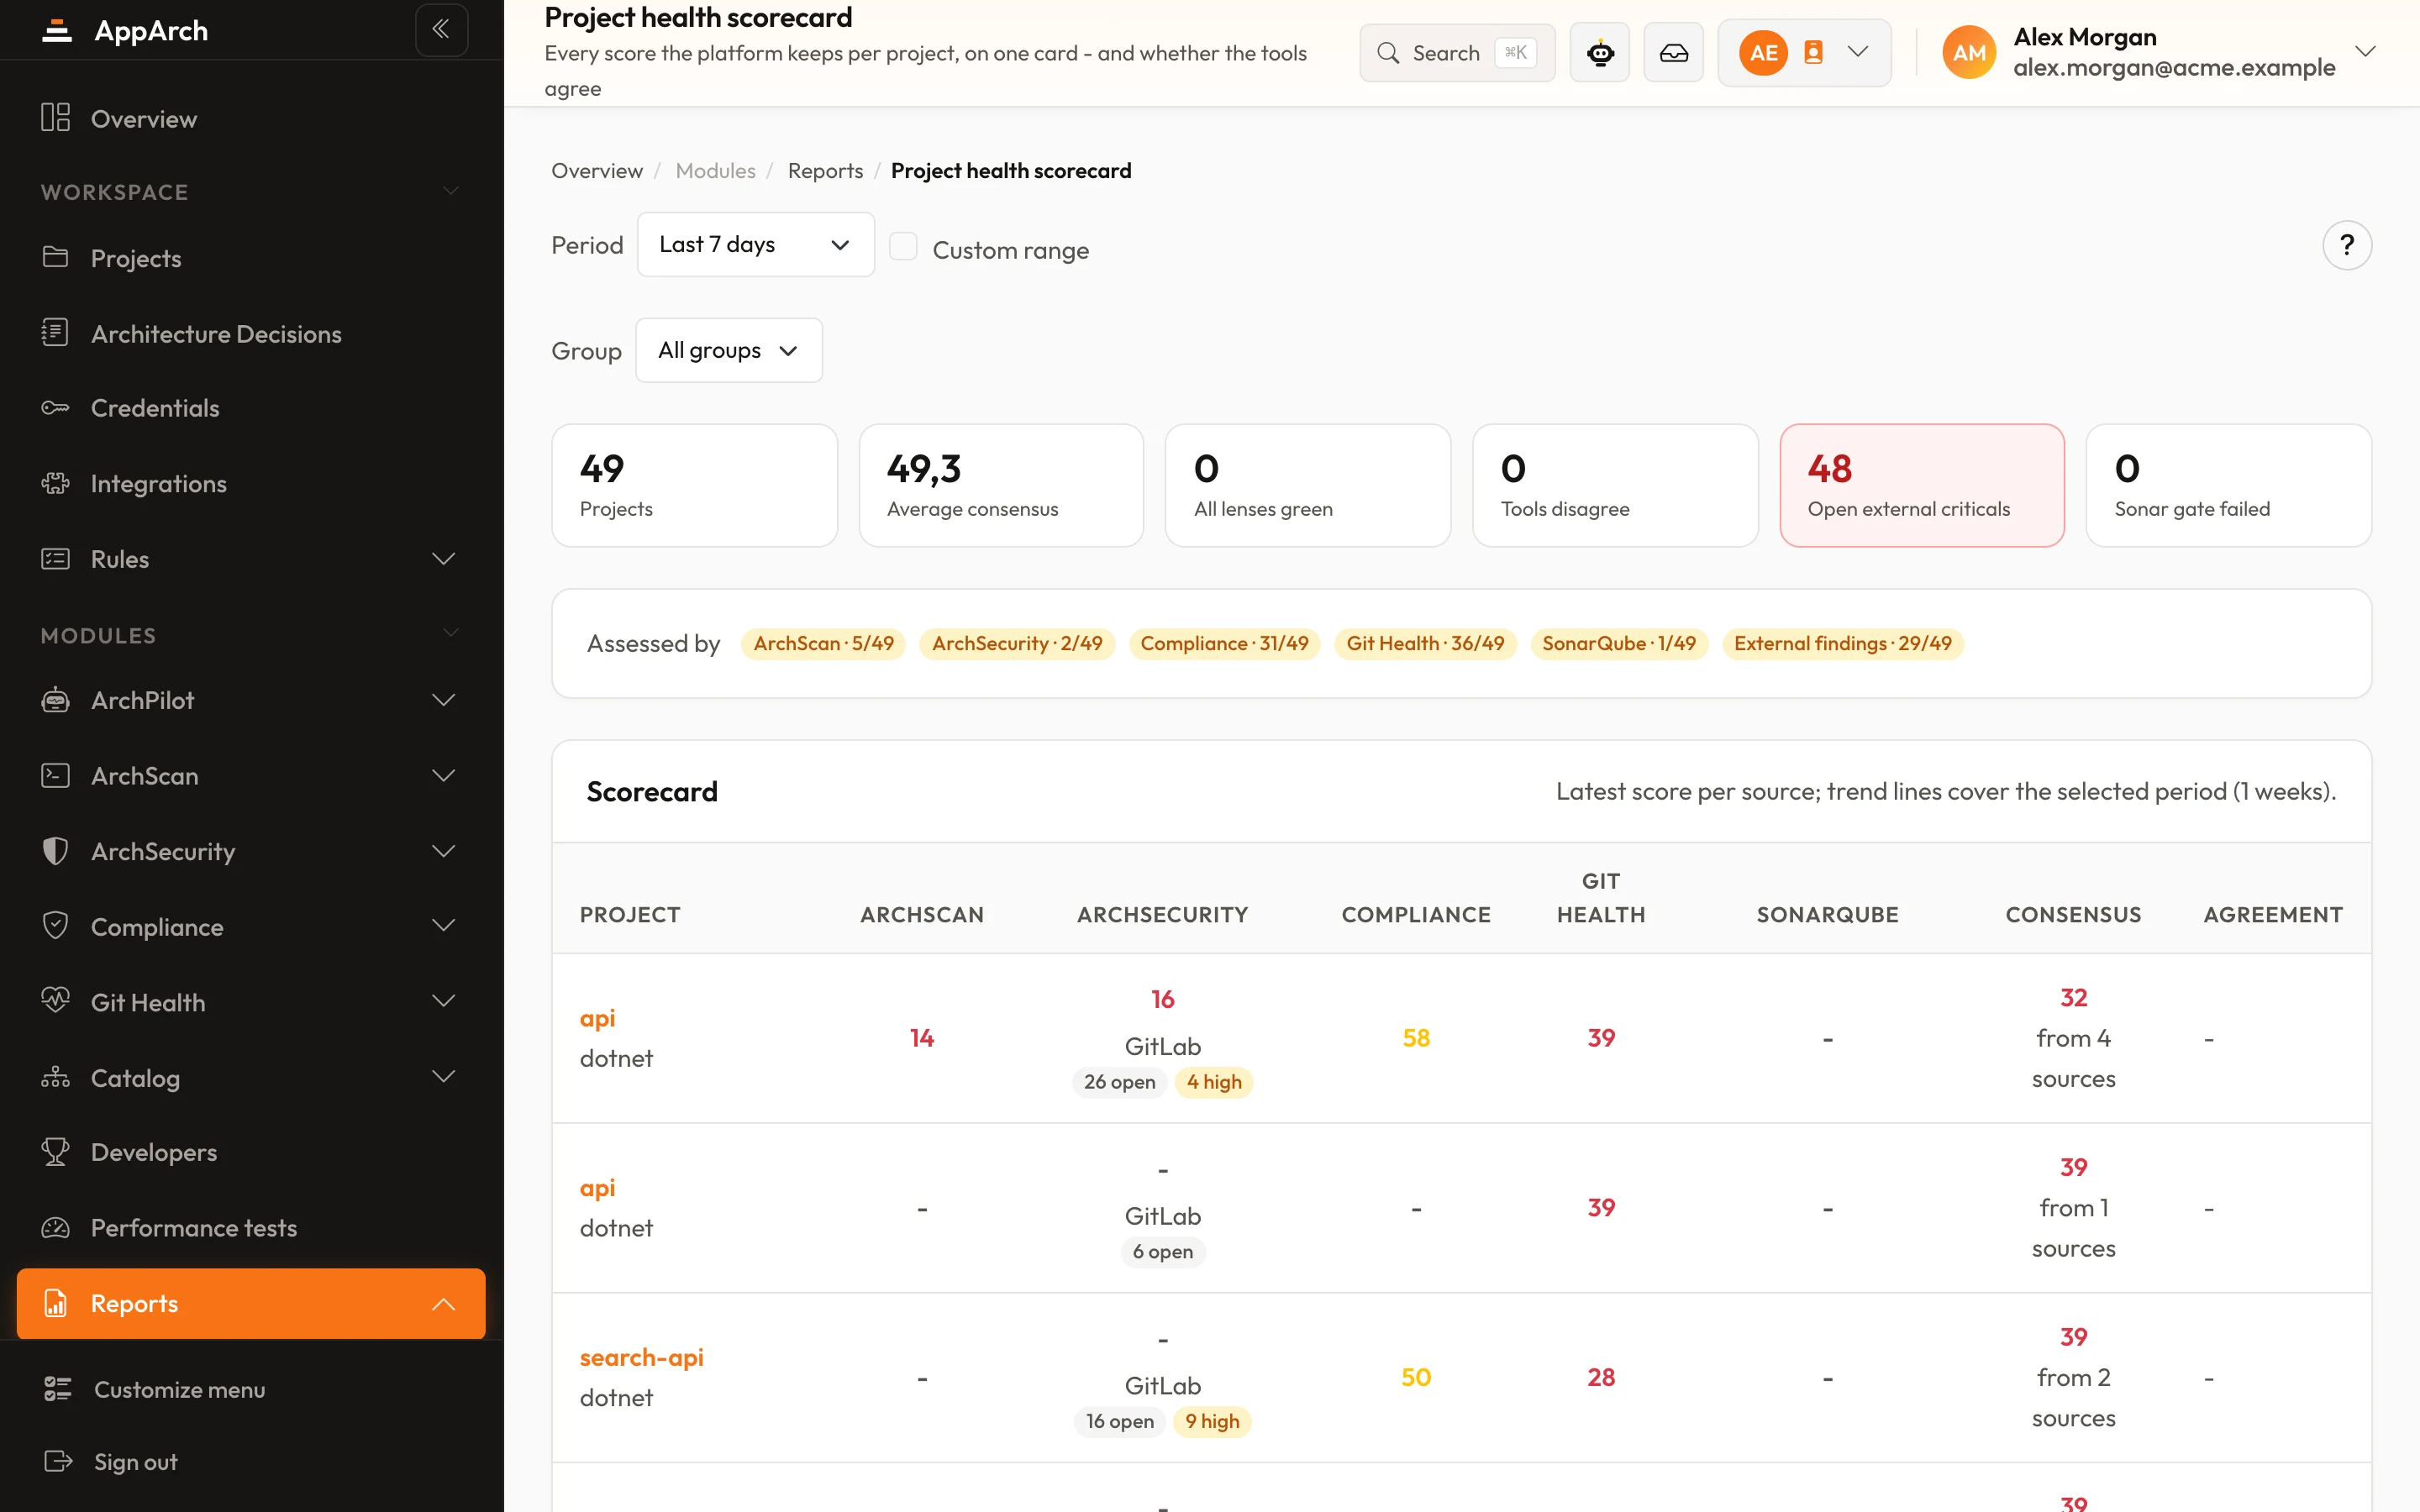
Get your first report in minutes
Connect, scan, see your score - scans run on your own infrastructure.